

Getting Started
When you first log into Kubex, you’ll be presented with a getting started page that walks you through the process of connecting your Kubernetes clusters to Kubex.
Figure: Data Collection Status Page
Installation
To deploy the Kubex Collection Stack, follow these steps below:- Determine your sizing file as described in Sizing and download it.
- Download values-edit.yaml.
-
If deploying on OpenShift, use the OpenShift overlay file: values-openshift.yaml.
User workload monitoring must be enabled in your OpenShift cluster to allow ephemeral storage and/or custom metrics data collection.
Update the
cluster-monitoring-configConfigMap:Ensure the config contains:If thecluster-monitoring-configConfigMap does not exist, create it with: -
Edit
values-edit.yamlwith the relevant mandatory parameters as described in Configuration. - To add the helm repos, run:
kubex-crds chart must be installed before the stack creates automation-engine resources.
- If your cluster is not OpenShift, run this command:
- If your cluster is OpenShift, run this command:
--set options after the OpenShift overlay.
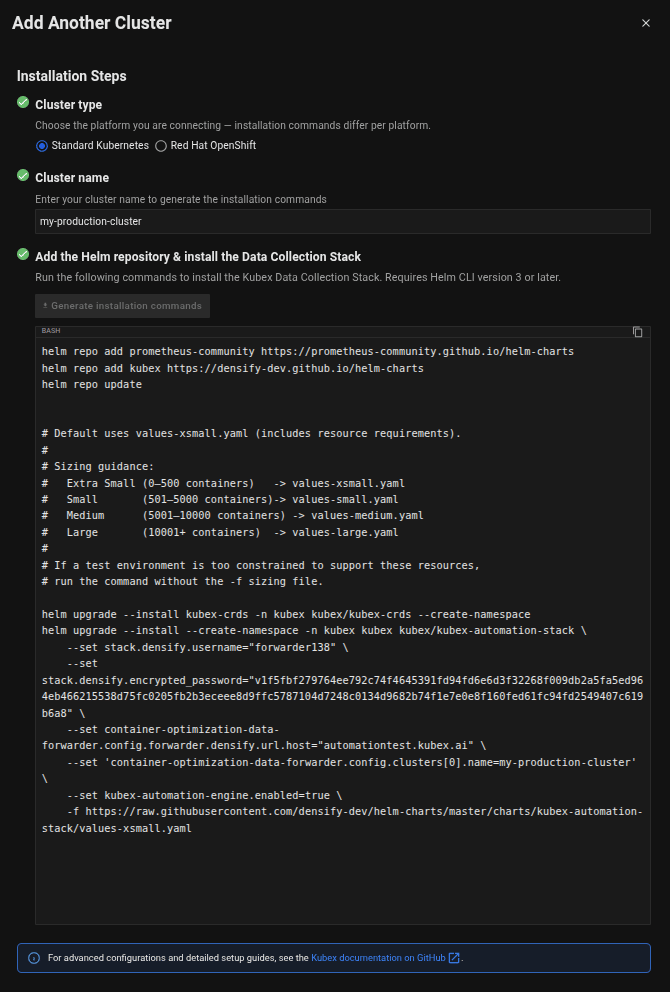
Figure: Data Collection Status Page
Data Collection Status & Adding More Clusters
After deploying Kubex data collection, data will begin flowing within an hour. You can monitor the status of each cluster connection through the data collection status page, which is also accessible from the side panel. Kubex performs data analysis hourly, so data flowing in today will show analyzed results within the hour.
Figure: Data Collection Status Page